The Stochastic Momentum Index (SMI) helps traders gauge an asset’s price momentum. It expands on the Stochastic Oscillator, which George Lane developed in the 1950s, to examine price trends and identify potential reversals.
Understanding the Stochastic Oscillator
To understand the SMI, you need to know about the Stochastic Oscillator. This tool compares an asset’s closing price to its price range over a specific time. The price range is the difference between the highest and lowest prices during that period.
The Stochastic Oscillator produces two lines: %K and %D. The %K line indicates the current closing price as a percentage of the price range over a set period (14 days). The %D line acts as a moving average of %K often a 3-day simple moving average.
How to Calculate the SMI
The SMI calculation resembles the Stochastic Oscillator but uses a wider value range and responds more to closing prices. To compute the SMI, you take the difference between the current closing price and the median of the high/low price range over a specific period. Then, you divide this difference by the absolute value of the high/low range and multiply by 100.
The SMI produces two lines: the SMI line and the signal line. The SMI line indicates the momentum of the asset’s price, while the signal line represents a moving average of the SMI line (a 3-day simple moving average).
Understanding SMI Signals
To interpret SMI signals, you can apply a technique similar to the one used for the Stochastic Oscillator. When the SMI line crosses above the signal line, traders view it as a bullish indicator suggesting an increase in the asset’s price momentum. , a bearish signal occurs when the SMI line dips below the signal line indicating a decrease in price momentum.
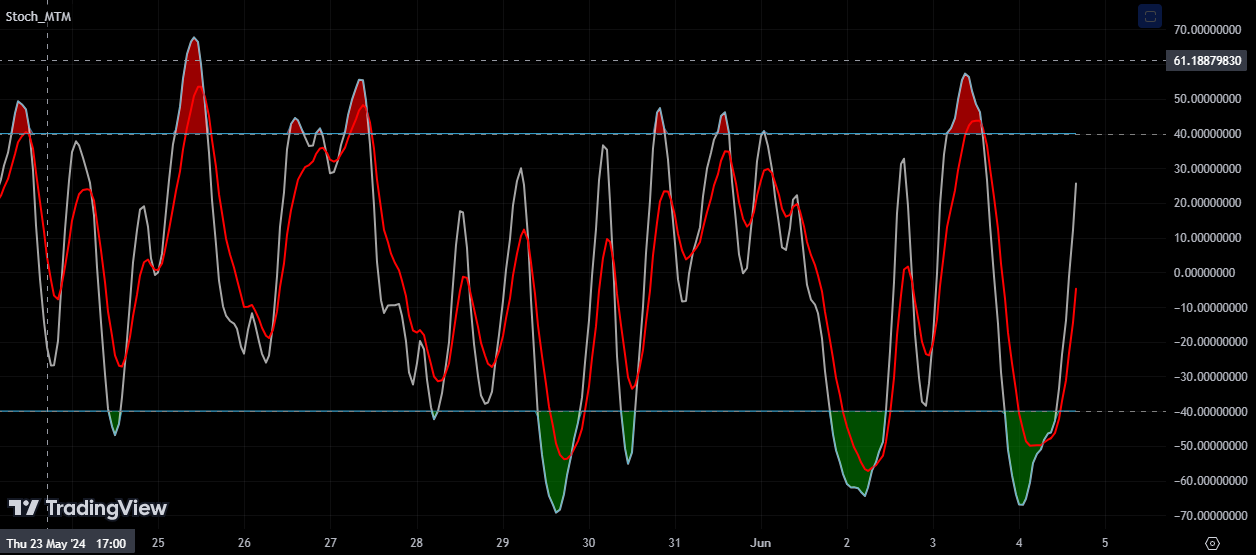
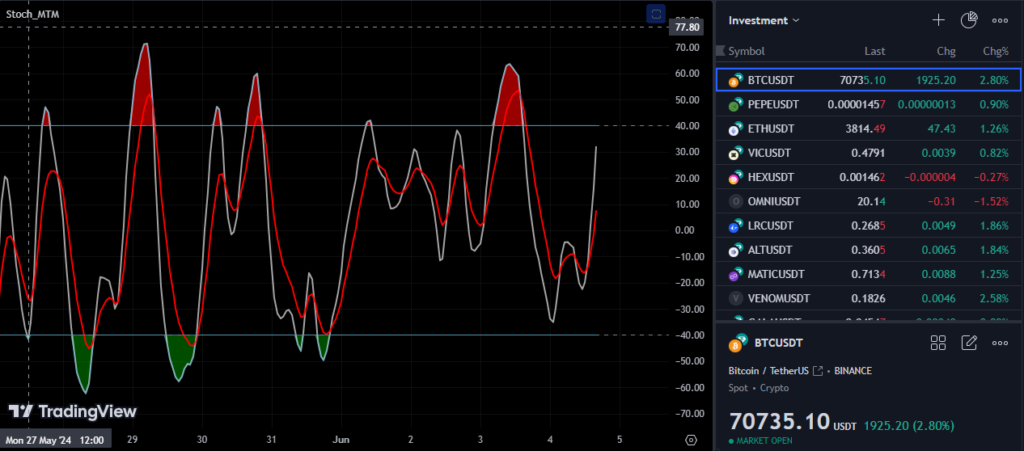
Traders can also use overbought and oversold levels to analyze SMI. When the SMI line goes above +40, people see it as overbought, which might mean prices will drop soon. When the SMI line falls below -40, it points to an oversold situation hinting that prices could bounce back.
Key Differences Between SMI and Stochastic Oscillator
The SMI and Stochastic Oscillator share some similarities, but they differ in key ways:
Enhancement: The SMI has earned a reputation as a more refined version due to its broader value range and improved reaction to closing prices. This results in fewer incorrect swings making the SMI a more reliable tool.
Understanding: The Stochastic Oscillator operates with two lines, while the SMI employs two lines and overbought/oversold levels to examine signals. This gives the SMI a more comprehensive edge providing deeper insights into price momentum.
Main Distinctions Between SMI and SMI Ergodic Oscillator
Both the Stochastic Momentum Index (SMI) and SMI Ergodic Oscillator have an impact on spotting overbought and oversold market situations. Yet, many think the SMI Ergodic Oscillator brings improvements to the original SMI.
The SMI Ergodic Oscillator reacts more to closing price shifts and uses a wider value range, making it less prone to give wrong signals than the SMI. Plus, it forms two lines and adds overbought/oversold levels to analyze, while the SMI gives one line. Traders often use these indicators together to get a better grasp of market conditions and make wise trading decisions.
How to Use the SMI in Your Trading Strategies
The SMI affects how we spot patterns and decide when to buy or sell. People often check for good or bad differences between the SMI line and the asset price.
Positive Difference: The SMI line climbs from its bottom while the asset price drops to new lows. This could mean the price might go up soon.
Negative Difference: The SMI line falls from its peak while the asset price reaches new highs. This might signal the price could drop soon.
Traders can also use overbought/oversold levels to find good times to buy or sell. When the SMI line goes above +40, it’s a sign to sell or take profits. When it drops below -40, it’s a sign to buy or start a long position.
Limitations and Risks to Keep in Mind
The SMI provides useful information, but it has limits and risks you should know about:
Historical Data Reliance: The SMI, like most technical indicators, relies on past data and can’t guarantee future outcomes. It’s best to use a mix of indicators and analysis methods for backup.
False Signals: The SMI has its flaws and can send incorrect signals during volatile or stagnant market conditions. Stay aware of market trends and exercise caution when interpreting SMI indicators.
What is the Stochastic Momentum Index (SMI)?
The Stochastic Momentum Index (SMI) serves as a technical analysis tool created to overcome the shortcomings of the traditional Stochastic Oscillator. The Stochastic Oscillator measures where the closing price sits in relation to the high-low range over a set timeframe. The SMI takes this concept further. It figures out the closing price’s position compared to the midpoint of the range offering a more accurate gauge of market momentum.
How to understand the Stochastic Momentum Index
The SMI moves between +100 and -100. Readings near these limits show stronger momentum. Here’s what the SMI tells us:
- When the market is overbought or oversold: An SMI above +40 suggests the market is overbought. This might mean a reversal or pullback is coming. On the flip side, an SMI below -40 hints that the market is oversold. This could signal an upward reversal is on the horizon.
- Signal Line Crossovers: The SMI often has a signal line, which is a moving average of the SMI. When the SMI and the signal line cross over each other, this can lead to buy and sell signals. A bullish signal happens when the SMI moves above the signal line, while a bearish signal occurs when it drops below.
- Centerline Crossovers: Moving above or below the zero line can also show a change in momentum. A shift above zero points to growing bullish momentum, while a move below zero suggests increasing bearish momentum.
Benefits of the Stochastic Momentum Index
- Better Accuracy: The SMI gives more exact readings by looking at the middle point of the high-low range instead of just the closing price.
- Less Interference: The SMI calculation uses double smoothing to cut down on incorrect signals and market chatter showing clearer trends.
- Flexibility: Traders can use the SMI on different time scales and trading tools, which makes it a handy instrument for many situations.
Using the SMI in Trading Plans
Traders have several options to include the SMI in their trading plans:
- Trend Confirmation: The SMI helps to confirm trends that other indicators spot. For example, if a moving average crossover points to a bullish trend, an SMI crossover above the signal line can back this up.
- Divergence: Keep an eye out for differences between the SMI and price movement. Bullish divergence happens when prices hit lower lows, but the SMI shows higher lows hinting at a slowdown in bearish momentum. Bearish divergence occurs when prices reach higher highs, but the SMI records lower highs signaling a decrease in bullish momentum.
- Overbought and Oversold Conditions: The SMI helps spot potential turning points when markets are overbought or oversold giving traders a chance to enter or exit at the right time.
To wrap up
The Stochastic Momentum Index (SMI) serves as a valuable tool for traders who want to boost their technical analysis skills. It offers a clearer view of market momentum and cuts down on noise leading to more reliable signals for trading choices. Adding the SMI to your trading plan can help you move through the markets with more accuracy and assurance, which can improve your trading results. Remember, like any indicator, it’s best to use the SMI along with other tools and methods to get the best outcome.