Purpose and Functionality of WaveTrend Oscillator
Understanding the WaveTrend Indicator: A Comprehensive Guide, The main purpose of the WaveTrend oscillator is to center the trend wave, reflecting the movements of the trend. Besides generating buy-sell signals, WaveTrend also indicates the direction of the trend, making it a highly functional indicator. Additionally, it includes overbought zones on the chart, providing valuable insights for traders.
Visual Appearance of the WaveTrend Indicator
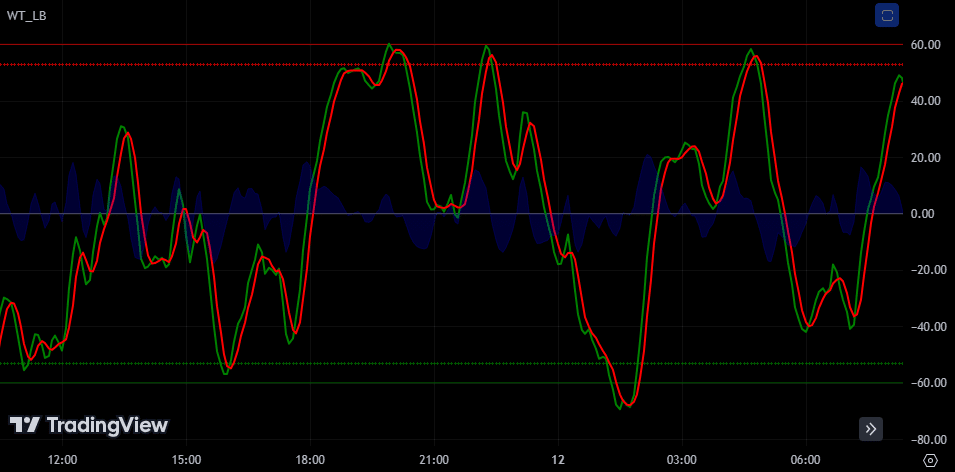
The WaveTrend indicator features a dense chart appearance. It includes overbought-sold lines, two lower and two upper lines, clouds (histogram) in the middle, and two value lines advancing above them. This indicator, which appears on the chart as two value lines, also has a cloud wave on the midline. The cloud wave forms upward and downward shapes, with clouds above the midline indicating a rise and clouds below indicating a fall. These clouds are essential for making buy-sell signal inferences.
Generating Buy and Sell Signals
When the green line crosses the red line upward, a buy signal is generated, leading to upward price movement except during periods of conflict. Conversely, when the green line crosses the red line downward, a sell signal is generated. Green and red points near the intersection indicate these signals.
How to Use WaveTrend
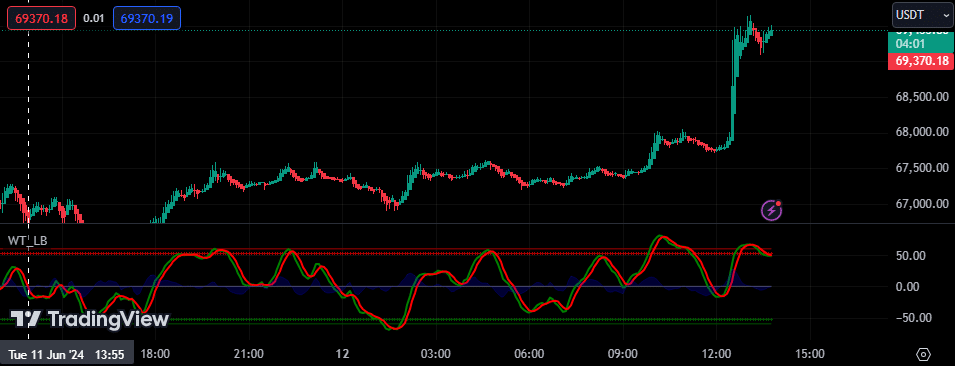
The WaveTrend indicator leaves green and red dots on trading points. Simultaneously, price candles change color to yellow for a buy signal and turquoise for a sell signal. For the most accurate results, it is recommended to trade in 12-hour or 1-day periods. Short-term trading may generate too many signals, leading to incorrect transactions.
WaveTrend Divergence
Similar to other momentum indicators, WaveTrend may show divergence between price and oscillators. Under normal conditions, rising peaks or falling lows are confirmed on the oscillator. However, divergence occurs when momentum does not confirm the price, leading to inconsistencies. These divergences are classified into two types:
Regular Bearish Divergence
When the price is peaking high, but the indicator peaks evenly, it results in a price decline.
Regular Bullish Divergence
When the indicator makes a higher bottom while price movements bottom out evenly, it leads to a price increase.
Combining WaveTrend with Other Indicators
No indicator, including WaveTrend, provides reliable results on its own. Therefore, confirming signals with multiple indicators or conducting joint analyses yields more accurate results. Commonly used indicators with WaveTrend include:
- WMA (Weighted Moving Average)
- CMF (Chaikin Money Flow)
- RSI (Relative Strength Index)
- MACD (Moving Average Convergence Divergence)
Apart from these, traders can develop their own analysis methods by incorporating other indicators for better trading strategies.
Disclaimer: This article is for informational purposes only and should not be considered financial advice. Always conduct your own research before participating in any airdrop or investment opportunity.
Join More Airdrop:
- Pi Network Airdrop
- AZCoiner Airdrop
- Satoshi Airdrop
- Grass Airdrop
- Athene Network Airdrop
- Celia Exchange Airdrop
- Bee Network Airdrop