The Stochastic RSI (StochRSI) is a tool for technical analysis that measures the momentum of the Relative Strength Index (RSI). It helps traders spot potential market turning points by checking if the RSI is overbought or oversold.
What is Stochastic RSI (StochRSI)?
StochRSI is a momentum oscillator that comes from the RSI. It uses the Stochastic Oscillator formula on a set of RSI values, which makes it a “second-layer” indicator based on price.
The standard RSI looks at how a security’s closing price compares to its recent price range to forecast possible reversals. StochRSI takes this analysis a step further by adding momentum, which gives a more responsive indicator for overbought and oversold states.
Getting to Know Stochastic RSI
Tushar Chande and Stanley Kroll created StochRSI to tackle the shortcomings of the RSI by making it more sensitive to market changes. While RSI moves between 0 and 100 (or 70 and 30 for overbought/oversold), StochRSI zeros in on a range of 0 to 1 (or 0.20 and 0.80).
This change in range enables StochRSI to create buy and sell signals more often than RSI, which might give traders more chances to make trades.
How to Calculate Stochastic RSI
Here’s the formula to work out StochRSI:
StochRSI = (Current RSI - Lowest RSI) / (Highest RSI - Lowest RSI) x 100
In this formula:
- Current RSI: The latest RSI value
- Lowest RSI: The smallest RSI value in the chosen time frame (14 periods)
- Highest RSI: The largest RSI value in the chosen time frame
Calculating StochRSI Step-by-Step:
- Get RSI readings for 14 days.
- Find the current RSI, the lowest RSI, and the highest RSI in the 14-day period.
- Do steps 1-2 again for each new period to create new StochRSI numbers.
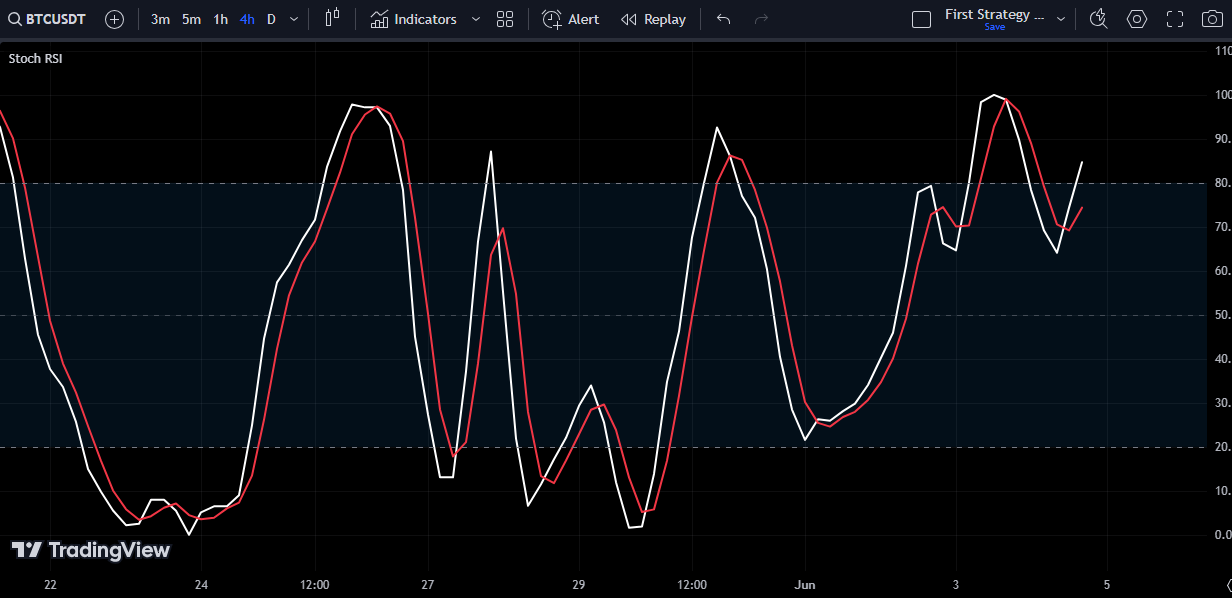
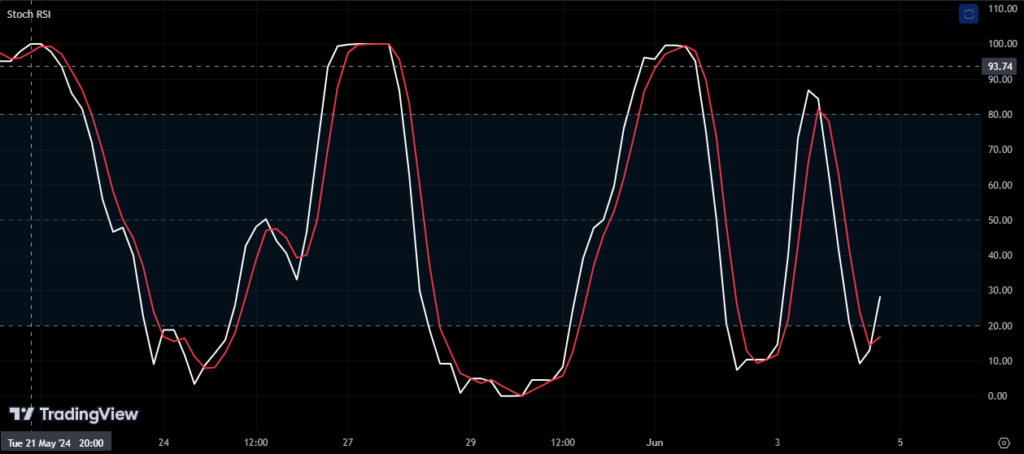
How to Read Stochastic RSI Signals
- Oversold: When StochRSI drops under 0.20, it points to an oversold market. This can mean a chance to buy, as the downward push might be running out of steam.
- Overbought: When it goes over 0.80, it hints at an overbought market. This could be a sign to sell, as the upward push might be losing strength.
- Trend Direction: The way StochRSI moves around its middle point (0.50) can show which way the short-term trend is going. Numbers above 0.50 mean prices are heading up, while numbers below 0.50 suggest they’re heading down.
Additional Considerations:
- StochRSI tends to be jumpy. Using smoothing methods like moving averages can cut down on noise and make signals clearer.
- When StochRSI and price movement don’t match, it can give useful clues about upcoming momentum changes.
Related Posts: Mastering Crypto Trading: Understanding Support and Resistance Levels
Stochastic RSI vs. Relative Strength Index (RSI)
StochRSI and RSI both use the idea of mean reversion, but they calculate things :
- RSI uses price data .
- StochRSI uses RSI values making it a secondary indicator.
This difference also changes how fast they move. StochRSI shifts quicker between overbought and oversold areas than RSI, which might create more frequent signals.
StochRSI adds momentum to RSI analysis giving traders a useful tool to spot possible market turning points and take advantage of overbought/oversold conditions. But keep in mind, it’s key to use StochRSI along with other technical indicators and risk management plans for a well-rounded trading strategy.