Introduction
The crypto trading world changes fast and can be unpredictable. To succeed, you need to understand how the market moves. Technical analysis is a useful tool that helps traders spot patterns and trends in crypto prices. This guide covers the basics of crypto technical analysis giving you the know-how to navigate the crypto trading scene with confidence.
What is Technical Analysis?
Technical analysis looks at past price and volume data to find patterns and trends that hint at future price moves. By studying charts, traders can spot potential support and resistance levels see when trends might reverse, and get a feel for market sentiment. This info helps traders make smart choices fine-tune their trading plans, and boost their odds of success.
Key Indicators in Crypto Technical Analysis
Technical analysis uses different indicators to show specific parts of market behavior. Some of the most common indicators in crypto trading are:
- Moving Averages: Help spot trends and possible reversals.
- Relative Strength Index (RSI): Gauges how fast and how much prices change.
- Moving Average Convergence Divergence (MACD): Checks momentum and how strong trends are.
- Bollinger Bands: Show volatility and potential price breakouts.
These indicators give useful insights into momentum, trend strength, and volatility. This allows traders to make smart choices about when to buy and sell.
Learn the Craft of Technical Analysis: Types of Indicators for Crypto Trading
Trend Indicators
These indicators show the market’s overall direction. Common examples include moving averages and trendlines.
Momentum Indicators
These indicators measure how fast and strong prices move. Examples include RSI and MACD.
Volume Indicators
These indicators check trading activity in a specific time frame. Examples include trading volume and on-balance volume (OBV).
Support and Resistance Levels
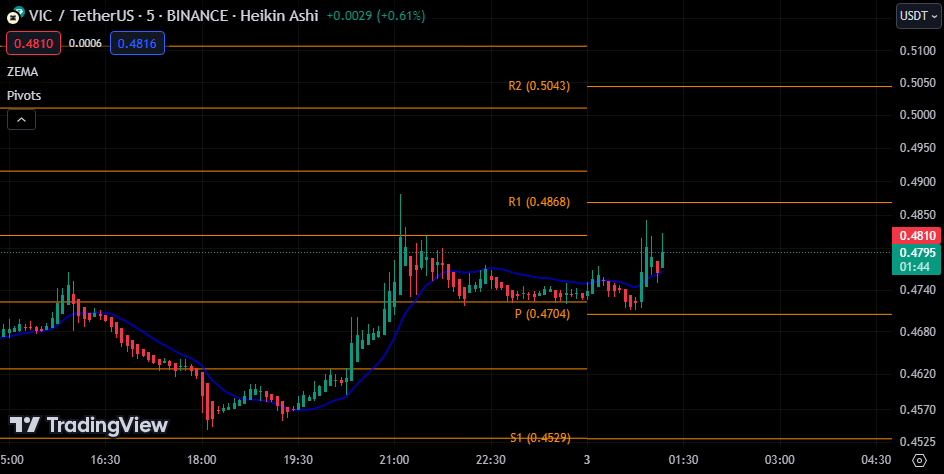
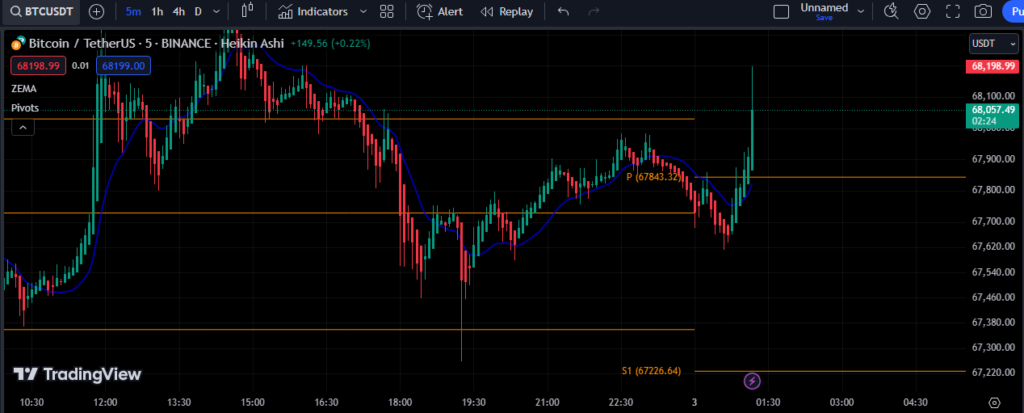
Support and resistance levels play a key role in technical analysis. Support levels point to where prices stop falling, while resistance levels mark where prices stop rising. Spotting these levels helps traders make smart choices.
To spot support and resistance levels, draw a straight line that links at least three past price points. This maps out where support and resistance zones might be. In the picture below, the orange line shows a possible resistance level, while the yellow line points to a potential support area.
When traders grasp and use these technical analysis basics, they can boost their methods and up their odds of doing well in the crypto market.